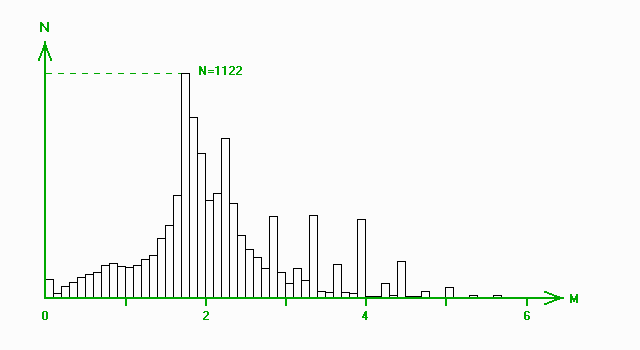
The diagramme for the distribution with magnitudes (M)

|
N - the number of events. The values of local magnitude from the earthquake catalogue and the values of magnitude obtained from the equations for the energy class have been used for this diagramme: M = (K - 1.3)/3; ( if M < 1.8 ); M = (K - 4)/1.8; ( if M ≥ 1.8 ). |
General Information Main Menu