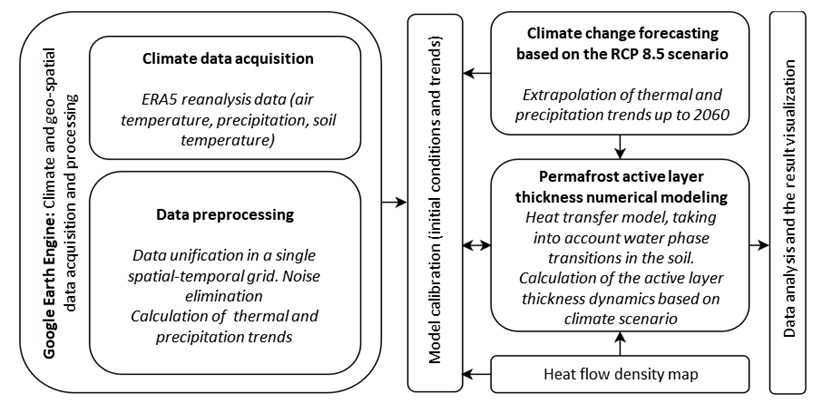
Forecast data for seasonal permafrost thawing up to 2060 were obtained using numerical
modeling of heat transfer within the permafrost zone and active layer, taking into account the
heat flow variations from the Earth's interior and climatic factors.
The RCP 8.5 climate model [Riahi et al., 2007] as a surface condition
and the heat flow map obtained within the project (as a lower boundary condition) were used as boundary
conditions adjusting for permafrost dynamics. A block diagram of the sequence and interactions of the study stages
is shown in Figure 1.
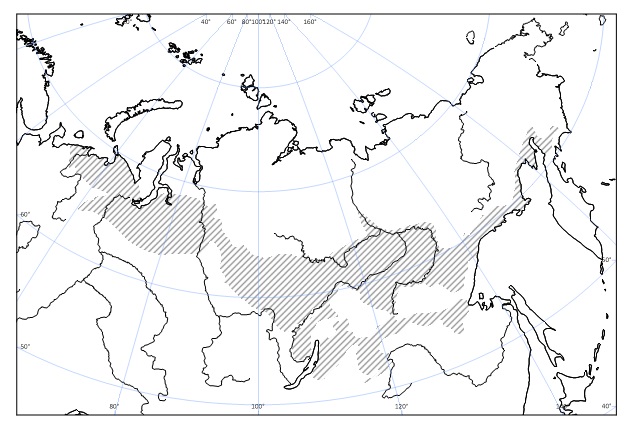
As a result, projected permafrost changes were obtained for a vast region of the
Russian Federation, highlighting areas where critical thaw (disappearance) is expected by 2060 (Figure 2).
The forecast, in particular, predicts a significant increase in the active layer depth over the next
several decades in southern Yakutia and Krasnoyarsk Krai. On the Yamal Peninsula and in the Khanty-Mansi
Autonomous Okrug (Western Siberia), seasonal thaw will become increasingly intense.
These results can be useful in permafrost science, ecology, climatology, assessing engineering
and geological conditions, developing and maintaining critical infrastructure for industry, transportation,
and housing, and analyzing natural hazards associated with permafrost degradation.
The data resolution is 0.5° latitude and 0.5° longitude.
The data is designated as follows:
Thawing_Russia_2060.txt
Data format description.
In the thawing data, a value of 1 corresponds to the presence of thawing, while 0 means that no thawing is occurring at a given point.