|
|
A new model of tectonic zoning of the lithosphere of the West Siberian Basin
based on a set of various geophysical data
A new model of tectonic zoning of the lithosphere of the West Siberian Basin, obtained from
a joint analysis of several independent geophysical parameters using unsupervised machine learning methods (K-means).
Figure 1 shows the initial data for tectonic zoning: lithosphere thickness (Hl), crust thickness (Hc),
sedimentary cover thickness (Hs), surface heat flow (Q), S-wave velocity anomalies at a depth of 100 km (dVs_100),
and topography (topo).
These layers are reduced to a single representation so that each point corresponds to a vector with values
for all parameters, which is then used in clustering. These parameters are selected to simultaneously describe
the thermal state of the lithosphere, the structure of the crust, the history of sediment accumulation,
and other features of deep and surface processes. It is important that the authors specifically harmonise the data
into a single set (single grid, single reference frame), otherwise the comparison of spatial patterns and statistical
classification lose their meaning.
As a result of a comprehensive cluster analysis of all parameters, a lithosphere zoning map was created
(Figure 2). Six clusters (k = 6) were identified, which form predominantly connected areas
and are interpreted as lithospheric domains differing in characteristic combinations of Hl, Hc, Hs, and Q.
The identified clusters allow us to link the observed heterogeneity of the lithosphere with the stages
of basin development (Palaeozoic accretion events, Mesozoic rifting and subsequent basin submergence) and to
identify domains with different structural and thermal characteristics.
In particular, cluster 1 corresponds to the area with the thickest lithosphere and moderate heat flow
(average values of Hl ≈ 161 km and Q ≈ 59 mW/m2) and occupies the central and northern parts of the basin;
cluster 3 is characterised by the maximum thickness of the sedimentary cover with a relatively thin crust
(Hs ≈ 7.7 km,
Hc ≈ 33.7 km) with moderate Hl and Q (Hl ≈ 140 km, Q ≈ 54 mW/m2)
and is represented in the northern and north-eastern regions. It is these two domains that contain the highest concentration
of large oil and gas fields marked on the map, which is consistent with the idea of the diagnostic role of the combination
of structural and thermal parameters for the regional identification of favourable areas within the West Siberian Basin.
The study area extends from 50.8° to 73.6° north latitude and from 60° to 93.8° east longitude, covering the West Siberian Lowland.
Table 1. Summary of geophysical parameters used in the study
| Parameter |
Symbol |
Unit |
Data source |
Value range |
| Lithospheric Thickness |
Hl |
km |
LITHO1.0 model
[Pasyanos et al., 2014] |
∼65 to 200 km |
| Crustal Thickness |
Hc |
km |
CRUST1.0 model
[Laske et al., 2013] |
∼30 to 50 km |
| Sedimentary Layer Thickness |
Hs |
km |
Derived from CRUST1.0 basement depth
[Laske et al., 2013] |
Up to 8 – 12 km |
| Surface Heat Flow |
Q |
mW/m2 |
IHFC database
[Fuchs et al., 2023,
Neumann et al., 2025,
Duchkov et al., 2012] |
25 to 80 mW/m2 |
| S-wave Velocity Anomaly |
dVs_100 |
km/s |
REVEAL model
[Thrastarson et al., 2024] |
−0.2 to +0.2 km/s |
| Topography |
topo |
m |
[Tozer et al., 2019 ] |
0 – 450 m |
The step for all parameters in latitude is 0.2°, and in longitude — 0.2°.
The data array includes a set of files for each parameter.
Data format description.
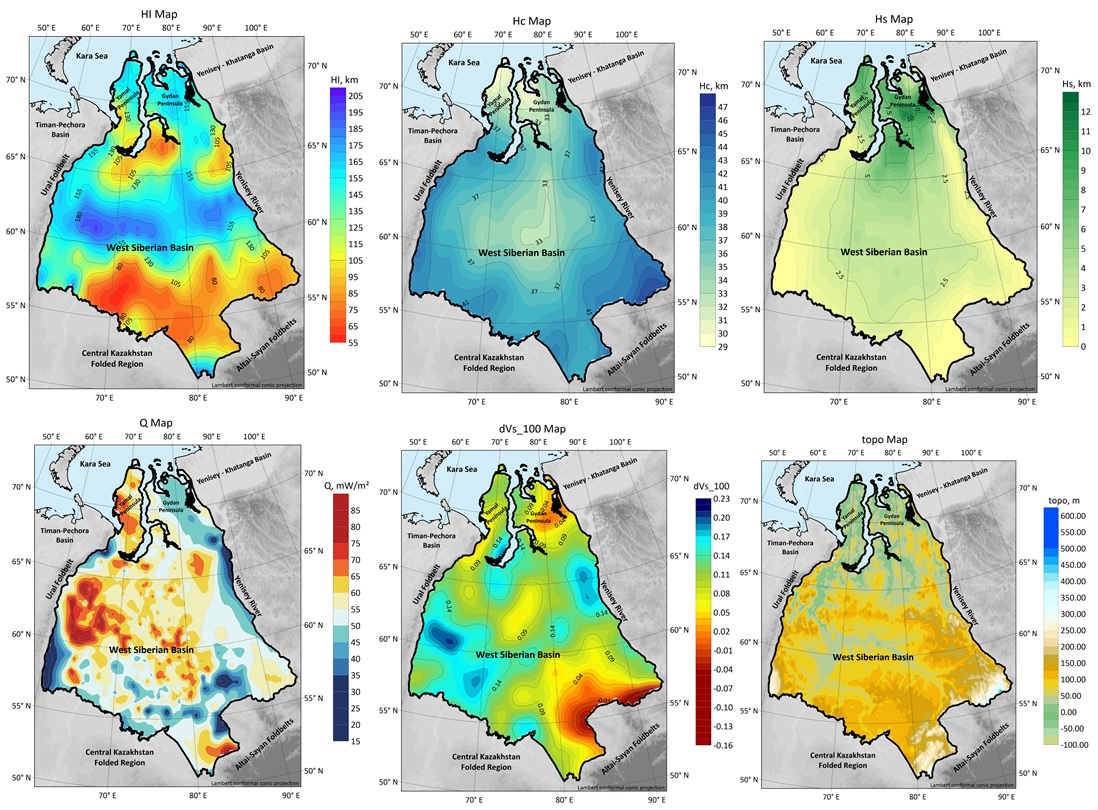
Figure 1. Spatial distribution of lithospheric (Hl), crustal (Hc), sedimentary (Hs)
thickness
across West Siberia Lowland (WSL), derived from the LITHO1.0 and CRUST 1.0 models
[Pasyanos et al., 2014; Laske et al., 2013], heat flow (Q)
[Fuchs et al., 2023; Neumann et al., 2025;
Duchkov et al., 2012],
S-wave velocity anomaly at a depth of 100km (dVs_100)
[REVEAL model, Thrastarson et al., 2024],
and topography (topo) [Tozer et al., 2019]
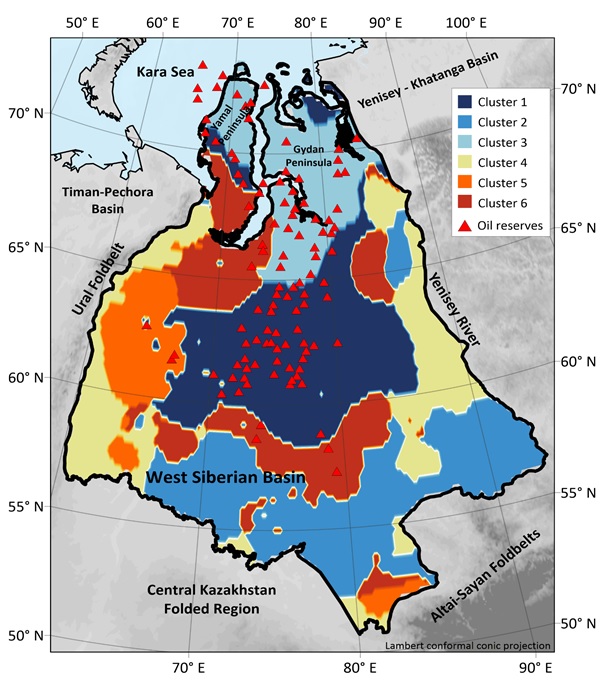
Figure 2. Spatial distribution of the six clusters across the West Siberian Basin
(bounded by the thick black line). Each cluster is color-coded, presenting distinct domains derived
from the integrated geophysical dataset. Red triangles represent locations of hydrocarbon giant
fields within the WSB [Khafizov et al., 2022
In 2025, new heat flow maps Q were created for the West Siberian Basin for
depths of 10 km and 20 km
(figure 3), as well as temperature maps for the same depths (figure 4)
based on the updated international heat flow database Global Heat Flow Database [Neumann et al., 2025]
and national sources (including the Geothermal Atlas of Siberia and the Far East) [Duchkov et al., 2012],
followed by harmonisation and conversion to a single regular grid using the ordinary Kriging method on a sphere (Python/pykrige)
[Murphy et al., 2022].
Within the West Siberian Basin, the heat flow shows pronounced lateral heterogeneity: elevated values
(up to ∼80 mW/m2)
are associated with the structures of the Ural fold belt and the central uplifts of the basin, while minima (< 25 mW/m2)
are characteristic of the north-eastern part (Yenisei-Khatanga trough), which is interpreted as a manifestation of the influence of the cold
and stable lithosphere of the adjacent Siberian craton on the thermal regime of the basin.
The study area extends from 50.8° to 73.6° north latitude and from 60° to 93.8° east longitude, covering the West Siberian Lowland.
Heat flow values are given in mW/m2, temperature values in °C.
The step for all parameters in latitude is 0.2°, and in longitude – 0.2°.
The data has the following designation:
WSB_Q_10km.grd — heat flow data at a depth of 10 km for the West Siberian Lowland.
WSB_Q_20km.grd — heat flow data at a depth of 20 km for the West Siberian Lowland.
WSB_temperature_10km.grd — temperature data at a depth of 10 km for the West Siberian Lowland.
WSB_temperature_20km.grd — temperature data at a depth of 20 km for the West Siberian Lowland.
Format description.
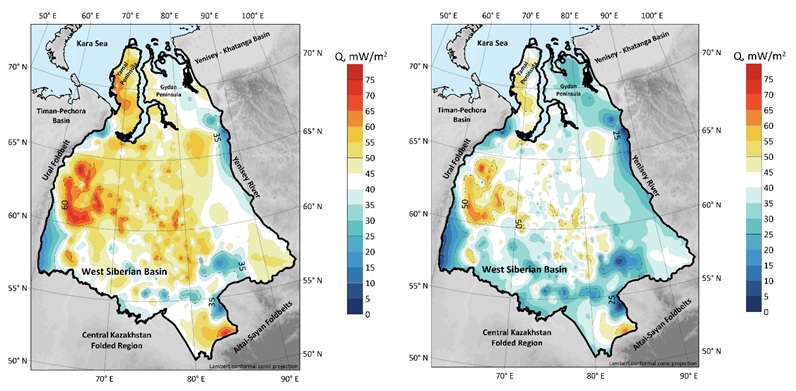
Figure 3. Heat flow map at depths of a) 10 km and b) 20 km
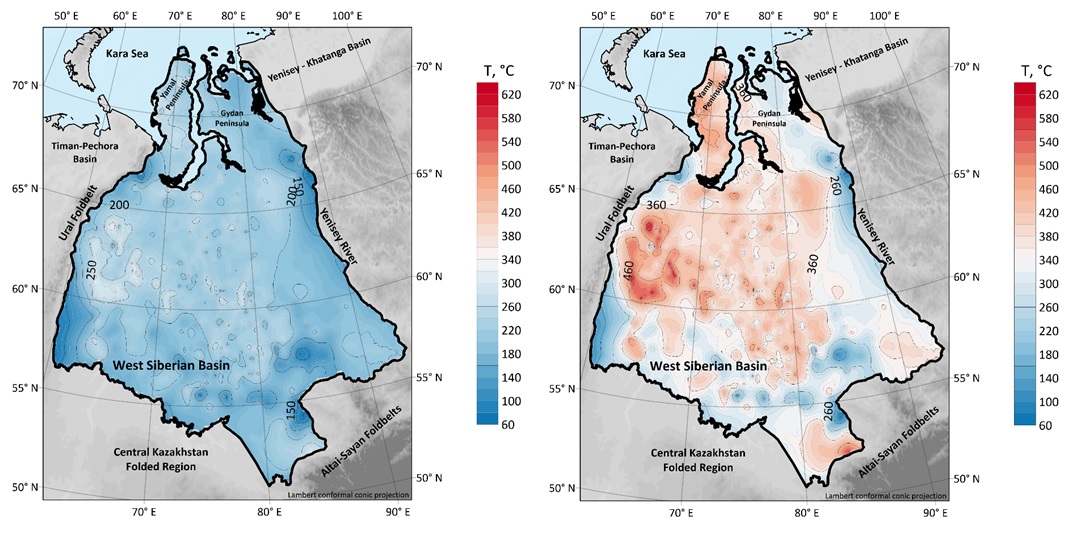 --> -->
Figure 4. Temperature map at depths of a) 10 km and b) 20 km
Authors of the work: Petrunin A.G.1, Kaban M.K.1, Fuchs S.2, Shevaldysheva O.O.1
1 GC RAS, 2 GFZ Potsdam
The results will be published in the article "Integrated Geophysical Cluster Analysis for the Tectonic Zonation of the West Siberian Lithosphere" in RJES.
References
Pasyanos M. E., Masters T. G., Laske G., Ma Z.
LITHO1.0: An updated crust and lithospheric model of the Earth //
Journal of Geophysical Research: Solid Earth. 2014. Vol. 119, No. 3. P. 2153–2173.
https://doi.org/10.1002/2013JB010626
Laske G., Masters G., Ma Z., Pasyanos M.
Update on CRUST1.0 – A 1-degree global model of Earth’s crust //
Geophysical Research Abstracts. 2013. Vol. 15. Abstract EGU2013-2658.
Fuchs S., Norden B., Neumann F., Kaul N., Tanaka A., Kukkonen I. T., et al.
Quality-assurance of heat-flow data: The new structure and evaluation scheme of the IHFC Global Heat Flow Database //
Tectonophysics. 2023. Vol. 863. Article 229976.
https://doi.org/10.1016/j.tecto.2023.229976
Neumann F., Norden B., Balkan-Pazvantoglu E., Elbarbary S., Petrunin A. G., Elger K., et al.
The 2024 release of the Global Heat Flow Database (GHFDB): Quality assessment, metadata standards, and a century of geothermal data //
Earth System Science Data Discussions. 2025. P. 1–48.
https://doi.org/10.5194/essd-2025-341
Duchkov A. D., Zheleznyak M. N., Ayunov D. E., Veselov O. V., Sokolova L. S., Kazantsev S. A., et al.
Geothermal Atlas of Siberia and the Far East.
2012. Digital resource. URL: http://sibgeotherm.ipgg.sbras.ru/
Thrastarson S., van Herwaarden D.-P., Noe S., Schiller C. J., Fichtner A.
REVEAL: a global full-waveform inversion model //
Bulletin of the Seismological Society of America. 2024. Vol. 114 (3). P. 1392–1406.
https://doi.org/10.1785/0120230273
Tozer B., Sandwell D. T., Smith W. H. F., Olson C., Beale J. R., Wessel P.
Global bathymetry and topography at 15 arc sec: SRTM15+ //
Earth and Space Science. 2019. Vol. 6, No. 10. P. 1847–1864.
https://doi.org/10.1029/2019EA000658
Khafizov S., Syngaevsky P., Dolson J. C.
The West Siberian Super Basin: The largest and most prolific hydrocarbon basin in the world //
AAPG Bulletin. 2022. Vol. 106, No. 3. P. 517–545.
https://doi.org/10.1306/11192121086
Murphy B., Yurchak R., Müller S.
GeoStat-Framework/PyKrige: v1.7.0 : Kriging Toolkit for Python. Zenodo, 2022.
Digital resource. URL: https://zenodo.org/records/7008206.
DOI: 10.5281/zenodo.7008206.
|
|
|
|


